Thursday, 23 May 2013

Triangle Mysteries

Here's a great pattern investigation, that got all of us in Year 5G thinking about patterns in a fresh way - fresh because we'd not come across anything quite like it before.

The activity comes from Steve Humble, and appears in the New York Times. We didn't look at the random aspect of it; we concentrated on what we could see in terms of patterns and rules.

The idea is to to start off with an empty grid like this:
You could download it yourself and have a go...
opening it in Paint. Each hexagon in the top row is filled with blue, red or yellow.

Then for the second row these are the rules:
  1. If the two hexagons above are the same colour as each other, then the hexagon below is that colour. 
  2. If the two hexagons above are different colours, then the hexagon below is the third colour.

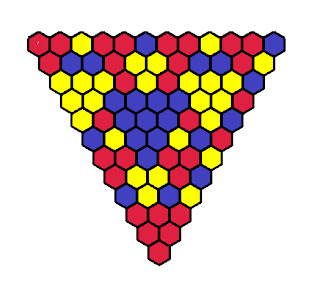
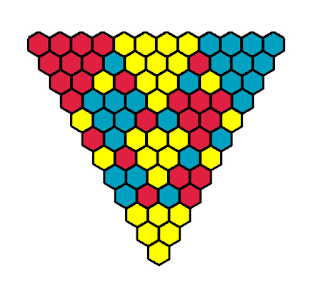
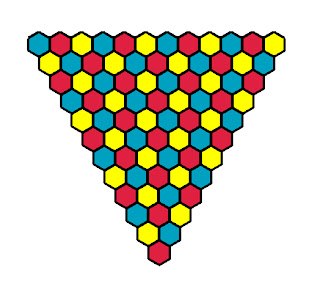
Here are some of our patterns:


The patterns are great, but it was the thinking that was the most interesting part!

Here are some of our thoughts, our general statements, about the patterns. Some of them are not in fact true, some of them need investigation...


William: With some of them you turn them and you get the same pattern.

Sophia: There's often a triangle in the pattern.

Jessica: Sometimes you can guess what the colour will be at the bottom.

Chris: If you start with just red and yellow the bottom hexagon will be blue. (Is this always true??)

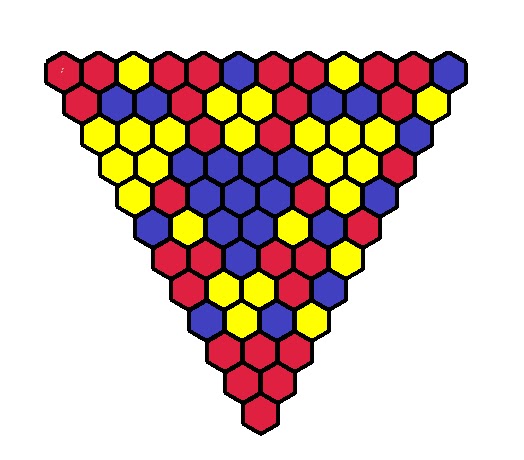
Christophe: The only one that doesn't have a triangle of colour in it is mine:
Florian: You never know what the colour will be at the bottom.

Jessica: You can tell if it's done correctly because usually there are downward-pointing triangles, never upward-pointing triangles.

Jessica: There is usually a pattern but not always.

Anna: The pattern still works when it is rotated.

Anna: Some of the shapes are symmetrical.


The next day, some of us had time to model a few triangle mysteries in other materials:


and in the playground -


Tuesday, 21 May 2013

Minigolf

This is a lesson about a minigolf hole, a ball and some bounces off the wall, adapted from a great activity shared by Fawn Nguyen on her blog.

We'd looked before at how to find he quickest route between two points that also touches a line: reflect one of the points first.

Luckily, plenty of children remembered this when we tried out some tricky shots in a game of minigolf.

First we had a go at creating some courses with an obstacle between the ball and the hole.


We did this using Geogebra. Within a rectangle we put a ball and a hole, and an obstacle between the two.

Have a look at it in GeoGebra Tube.

Then we looked at how the Reflect Object about Line tool could be used to find the reflected point. From there it was mostly straightforward to work out the correct shot. If you can see the GeoGebra image above, you can have a go yourself.


There were one or two cases where people had put the ball in a very tricky place. This meant two bounces were needed:

Then, we had a go at doing this on paper, with different tools. This time we used the ruler to work out where the reflection of the ball should be, and the protractor to check the angle the ball hit the wall and the angle the ball left the wall:


In most cases we found that the two angles were the same! 

The idea of a game of minigolf seemed to work well as a practical context for talking about angles and reflections, and also for using geometry tools, online and physical. So much so that some students were all for a visit to the local minigolf "to study angles"!

Saturday, 11 May 2013

If the world were a village of 100 people - the Year 5 perspective

It was great once again to do maths work together as Primary and Secondary, and thanks to Jim Noble for orgainising it all! He's already begun blogging about this piece of learning here.

Year 5 dived into it with enthusiasm. First of all we looked at how world population is growing, using this site. It was a bit of a shock for some of us to see how many people were dying, or even that people were dying! But also amazing to see how steadily the world population is going up! (Mind you, as Jose said, "They can know that exactly, can they?")

We had a look at a graph:
at which point Emily made a very apropos kind of cartoon noise that seemed to sum up the graph brilliantly - a long trundle and then a sudden swannee-whistle ascent!

So, we were going to show all this, and lots more, with 100 students at IST.  And first of all we were going to have to make huge map in the playground on which it would all be played out. We got some A3 world maps:

and set off. Matt Podbury (who's blogged about this too!) was there with two of his Year 12 geography students to help us, and using the lines of longitude and latitude to guide us we copied the map, cell by cell, onto the tarmac using chunky chalks.


We got it done just in time for all the classes to assemble around the map:


(You can see Mr Noble up on the roof with the cameras.)

And so began our mapping:


After we'd shown population growth, we enacted some statistics for the people in the world. Like, "What proportion have a college (university) education?"


That person leaping:


is the one out of a hundred that has a college education. (When we looked at this the next day, all of us found it surprising how few people in the world go to college!)

Another one was, "If the world were a village of 100 people, how many would have a computer?"


You can see the ones with computers sitting on the left. When we talked and wrote about this  in class the next day, Emily wrote, "Surprisingly, out of 100 people, 7 have computers and 93 don't." It wasn't such complete news to Jessica though. She wrote, "I wasn't surprised because all over the world people don't have enough money to buy computers, however I wasn't expecting that only seven people out of one hundred have them."

There were a lot more thoughtful comments along these lines. Because we had acted out these diagrams, because we were in them, they were much more immediate. And talking about them, thinking about their meaning was a whole lot more interesting.

There were a lot more of these playground graphics, and you can see some of them on the blog posts I've linked to.

Monday, 15 April 2013

Minecraft Plans and Elevations!


This year we have had our first go at using minecraft in teaching maths! Love it or hate it people, are playing minecraft and whilst the addictive nature of the game is a genuine cause for concern, there seems to be a wonderful element of creativity involved along with some real potential for learning! With some yr 7 and 8 mths classes, we thought we would have a little go at seeing how we could use it. We went for something quite simple and used it as a context for exploring the drawing of 3D shapes, plans and elevations! Students made the shapes on my iPad whilst it was being projected and then we had a go at drawing their plans and elevations. With another class, we took screenshots of the shapes from different angles and used them to try and make isometric drawings of them. It is lovely that minecraft allows you to ‘orbit’ what you have built and look at it from different angles. Students then went on to make their own shapes in mincraft for homework and draw the corresponding plans and elevations. Some even did this in minecraft too! This is a real help with what we were trying to do. There is little doubt that, for now at least, the context was deeply engaging! Thats good enough for now, but we will keep thinking about ways to try and benefit from the minecraft craze! Below are some pictures of what we did. 


Trig Function Families

This is just a quick post about some fun year 11 had with this 'Trig function families' activity. Fun is in somewhat shorter supply as exams approach and so it was great to do something that can really help to understand ideas. The aim of the exercise is to help students understand how the shape of a trigonometric function and its equation are linked. Working with the general form of ....

f(x) = asinbx + c

Students were asked to try and make some of the different images that had been made by varying the values of a, b and c. This is quite different from simply seeing what happens when you vary the values, because you have a particular shape and image to work towards! The results can be very satisfying on the eye! See the slideshow below for some examples.

A slightly different take on the same idea is to try and make the following animations! They are quite are challenge! Are you up for it?


We did find that this was an excellent use for the brilliant online graphing calculator at Desmos. All in all this is an engaging and effective exercise!