For a number of years we have run this annual mirror dance activity at the International School of Toulouse, but this year we decided to make a bit more of an event of it! I first got the idea from a Workshop run by Anne Watson at the UK based ATM conference a few years ago!

The idea is simple! In groups of two or more, students must make a dance routine lasting between 60 and 90 seconds. The routine must be based on symmetry. in the first instance, reflective symmetry where students are each others reflection either side of an imaginary mirror line. Afterwards, students can consider using two (or more) mirror lines, before going on to consider translation, rotation and enlargement! Students were judged and given a score out of 10 in three different categories!
1. Aesthetic appeal
2. Technical difficulty
3. Symmetrical accuracy
The total scores were then divided by the year group the team came from as a bit of a leveller!
More important than that was amazing creativity shown by all of the students involved. It is wonderful to see how students will play with these mathematical ideas when the right circumstances are created and we are really impressed with and proud of the work our students did on this. We are also particularly pleased with the willingness they have shown to both take part and then perform in front of each other! Well done to all students who took part!
Students have chosen their own prize and that is that they are able to throw wet sponges at the maths teachers!
See also 'Maths and Feet' from Simon Gregg based activities from http://www.mathinyourfeet.com/ from Malke Rosenfeld
Here are some photos for now and there will be some videos to follow......


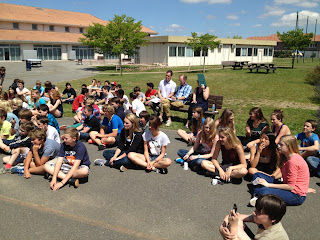


And now following the comment below, evidence of the prize giving!!!


The idea is simple! In groups of two or more, students must make a dance routine lasting between 60 and 90 seconds. The routine must be based on symmetry. in the first instance, reflective symmetry where students are each others reflection either side of an imaginary mirror line. Afterwards, students can consider using two (or more) mirror lines, before going on to consider translation, rotation and enlargement! Students were judged and given a score out of 10 in three different categories!
1. Aesthetic appeal
2. Technical difficulty
3. Symmetrical accuracy
The total scores were then divided by the year group the team came from as a bit of a leveller!
More important than that was amazing creativity shown by all of the students involved. It is wonderful to see how students will play with these mathematical ideas when the right circumstances are created and we are really impressed with and proud of the work our students did on this. We are also particularly pleased with the willingness they have shown to both take part and then perform in front of each other! Well done to all students who took part!
Students have chosen their own prize and that is that they are able to throw wet sponges at the maths teachers!
See also 'Maths and Feet' from Simon Gregg based activities from http://www.mathinyourfeet.com/ from Malke Rosenfeld
Here are some photos for now and there will be some videos to follow......


And now following the comment below, evidence of the prize giving!!!


