Showing posts with label mathematics. Show all posts

Wednesday, 10 February 2016

Thought Plants

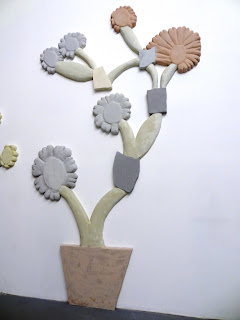
In Toulouse, at the Préface Gallery, two artists Charlie Youle and Bevis Martin are exhibiting some beautiful sculptures, "Thought Plants".
The Préface website says:
Thought Plants présente un ensemble de sculptures murales réalisées à partir de dessins de plantes faits par des enfants. Les dessins originels sont en réalité issus d’une méthode de calcul pédagogique et ludique destinée à faciliter l’apprentissage des mathématiques. Ainsi, derrière une représentation de la nature Bevis et Charlie nous donnent à voir la relecture d’un motif oscillant entre la spontanéité enfantine et la rigueur mathématique d’un algorithme.
The pictures that the artists based their work on were factor trees featured on this blog. In fact, that's where they encountered the trees! Mr Gregg was amazed when he first heard from the artists, who he'd not met before, about the project.
Miss Ash and Mr Gregg went to see the private view to open the exhibition. It was wonderful to see how the 2D shapes created by our students had been lovingly recreated in 3D in pastel shades that gave them a sense of being carved in colourful stone.
 In the basement there was more work based on a mathematical theme:
Miss Ash talking with Charlie Youle
The artists with Mr Gregg

Back in 2013 we posted about the factor trees that the Year 5s had created.
It was surprising and wonderful to see them being given a new life as artworks!

UPDATE

Charlie, Bevis and their daughter came to visit us at IST today - see the Year 4 blog.

Friday, 31 May 2013

Dynamic Symmetry


Years 7, 8 and 9 have been working on some dynamic symmetry problems. These are exemplified by the videos below. The task is quite simply described but less simply achieved..... 'Can you make the following animations using dynamic geometry? ( See the following links for more details... Kaleidoscope, Animated Questions for a discussion on these ideas and 'One Question Lessons' for more thoughts on this type of lesson.)


The activity ticks a lot of boxes, 
  1. The task is easily understood, 
  2. Students really want to have a go because they want to make these really cool animations,
  3. As they work and try things out, they can see straight away if they have achieved what they set out to do. As such, they are getting instant regular feedback on what they have done. they then refine each time trying to get closer to the stated aim. 
  4. In doing the above, students have to reason with each other and articulate mathematical definitions of what they think is going on, of what properties give rise to what behaviours. these are the sort of conversations that make me as a maths teacher delighted and they are very productive for students!
The end results are very pleasing indeed, both in terms of what students produce, but perhaps more importantly in terms of what exploration and discovery they have done together.

For the ambitious, we can then move on to this combination of rotation and reflection!


Older pupils, perhaps in year 9 or above might get interested in this great problem!! Watch carefully to see if you can figure out how this was made! there are lots of surprises in this one. See Dr Who for more details!


Students might go on to making some of the fabulous designs on show with this task - Olympic Logos
Our provision for technology opens lots of doors for us here in Toulouse! Firstly the ease with which we can have a go at these types of tasks and secondly, our choice of media for students to work in. Below are some of the videos that students created whilst doing this task!....


Saturday, 11 May 2013

If the world were a village of 100 people - the Year 5 perspective

It was great once again to do maths work together as Primary and Secondary, and thanks to Jim Noble for orgainising it all! He's already begun blogging about this piece of learning here.

Year 5 dived into it with enthusiasm. First of all we looked at how world population is growing, using this site. It was a bit of a shock for some of us to see how many people were dying, or even that people were dying! But also amazing to see how steadily the world population is going up! (Mind you, as Jose said, "They can know that exactly, can they?")

We had a look at a graph:
at which point Emily made a very apropos kind of cartoon noise that seemed to sum up the graph brilliantly - a long trundle and then a sudden swannee-whistle ascent!

So, we were going to show all this, and lots more, with 100 students at IST.  And first of all we were going to have to make huge map in the playground on which it would all be played out. We got some A3 world maps:

and set off. Matt Podbury (who's blogged about this too!) was there with two of his Year 12 geography students to help us, and using the lines of longitude and latitude to guide us we copied the map, cell by cell, onto the tarmac using chunky chalks.


We got it done just in time for all the classes to assemble around the map:


(You can see Mr Noble up on the roof with the cameras.)

And so began our mapping:


After we'd shown population growth, we enacted some statistics for the people in the world. Like, "What proportion have a college (university) education?"


That person leaping:


is the one out of a hundred that has a college education. (When we looked at this the next day, all of us found it surprising how few people in the world go to college!)

Another one was, "If the world were a village of 100 people, how many would have a computer?"


You can see the ones with computers sitting on the left. When we talked and wrote about this  in class the next day, Emily wrote, "Surprisingly, out of 100 people, 7 have computers and 93 don't." It wasn't such complete news to Jessica though. She wrote, "I wasn't surprised because all over the world people don't have enough money to buy computers, however I wasn't expecting that only seven people out of one hundred have them."

There were a lot more thoughtful comments along these lines. Because we had acted out these diagrams, because we were in them, they were much more immediate. And talking about them, thinking about their meaning was a whole lot more interesting.

There were a lot more of these playground graphics, and you can see some of them on the blog posts I've linked to.

Thursday, 28 March 2013

Maths and Feet

Year 5G have been devising and performing four-beat dance patterns with a variety of movements to explore shape and space.

We began by creating squares in the hall with masking tape, naming the directions on the squares and establishing a common language about them.

Next we started the four-beat patterns with simple "copying" of each other's feet positions and moves, where the same shape and movement is simply translated from one square to the next:


We devised our own notations for recording these on paper.


In the second session we revisited our first moves, then we looked at mirror reflection and tried to incorporate this into our four-step patterns.


The idea and inspiration for this activity came from Malke Rosenfield's brilliant "Math in Your Feet" program, though it should be said that ours is a very rough approximation of what is a much more developed and professional program. That said, there were a number of things that were really impressive about what the class did:
  • Their total concentration;
  • Their amazing and precise cooperation in pairs;
  • Their energy;
  • Their ability to devise notation to record positions and moves;
  • Their use of mathematical vocabulary to describe their patterns.
In this connection, it's worth watching the video and reading "What Success Looks Like" on this page on the Math in Your Feet site.
We used Malke Rosenfield's Movement Variables chart (which she includes in a really useful article here) to help consider some of the elements that should go into our patterns, and also to help record these patterns:
Altogether, it was a fantastic approach to maths learning, which we will hopefully refine and extend in the future.

Tuesday, 15 May 2012

Which Team is the Fastest?


A QUESTION OF TIME..?

As part of our IPC topic on the Olympics, we decided to run a relay race around part of our school grounds to see which team was fastest.  We have four house teams, Emerald, Ruby, Sapphire and Topaz.  Each student ran the 360m course and 'tagged' the next member of their team.  Individual times were recorded by hand using digital stopwatches.  Two teams ran at a time so that the others could do the timing.


However, despite our organisation, one person's time was not recorded.  In addition, the teams that didn't have 5 members had to have someone run twice which resulted in a much slower time.  This then led to thinking about what we should do to put this right.  Should we run again another day, or could we use mathematics to come up with a solution?  

So our problem is this, how do we make it fair for the teams with 4 members to compete with a team of 5?